Restaurant Menu Profitability Analysis
This project analyzes restaurant menu profitability through a complete analytical workflow, from data preparation to business-facing visualization.
Using Python (Pandas), both datasets were cleaned, validated, and merged into a single analytical dataset. During preparation, new business metrics were engineered — Unit Profit, Profit Margin, and Food Cost Percentage — allowing profitability to be evaluated beyond menu prices alone.
The processed dataset was imported into Tableau, where an interactive dashboard was developed to monitor restaurant performance through KPIs and visual analysis. The dashboard enables managers to compare menu categories, identify the most profitable items, evaluate food cost efficiency, and explore the relationship between price and profitability.
Python (Pandas), Tableau, Excel, Data Cleaning, Data Integration, Feature Engineering, Exploratory Data Analysis (EDA), KPI Development, Dashboard Design, Business Analytics, Data Visualization
Cleaning and validation of two independent restaurant datasets. Merging menu and cost information into a unified analytical dataset. Creation of business metrics including Unit Profit, Profit Margin, and Food Cost Percentage. Exploratory data analysis to identify profitability patterns. Category-level performance evaluation using profitability and cost indicators. Analysis of the relationship between sale price and unit profit. Interactive dashboard design in Tableau with KPIs and business-oriented visualizations.
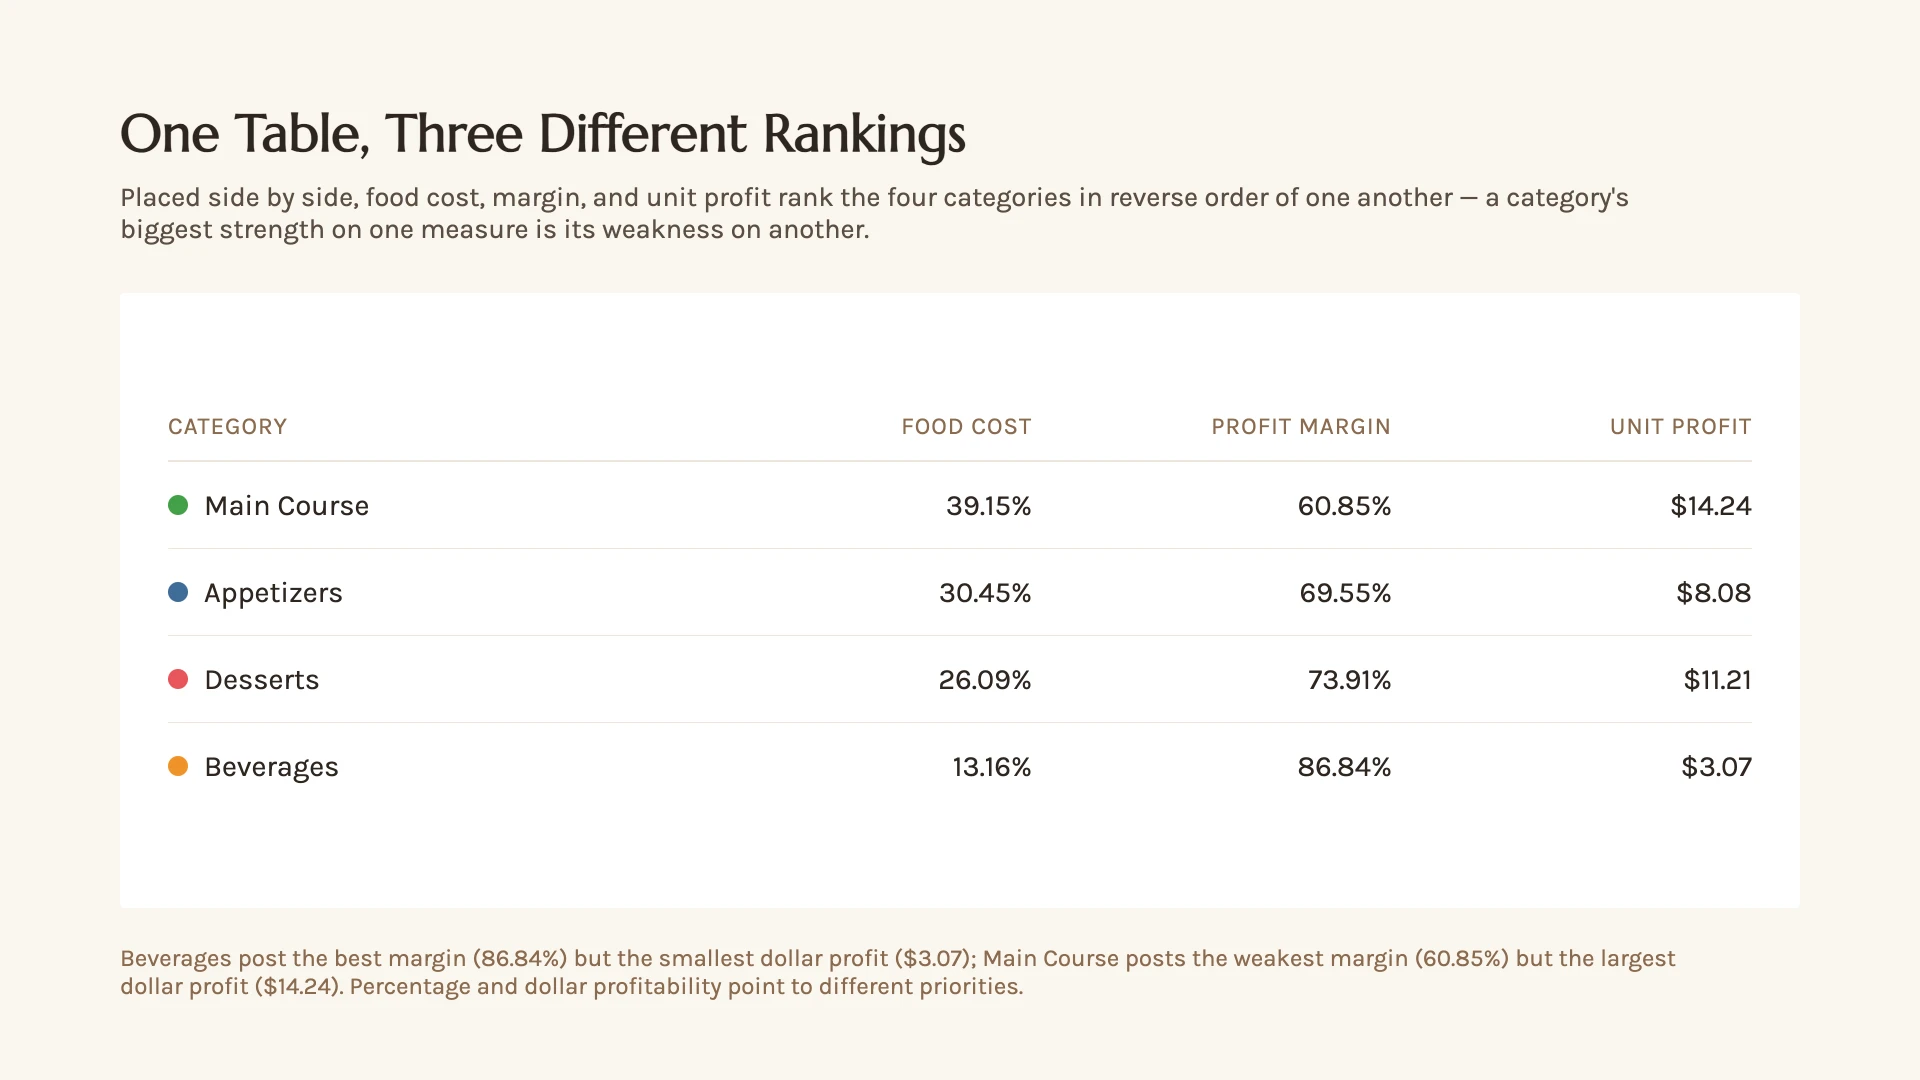
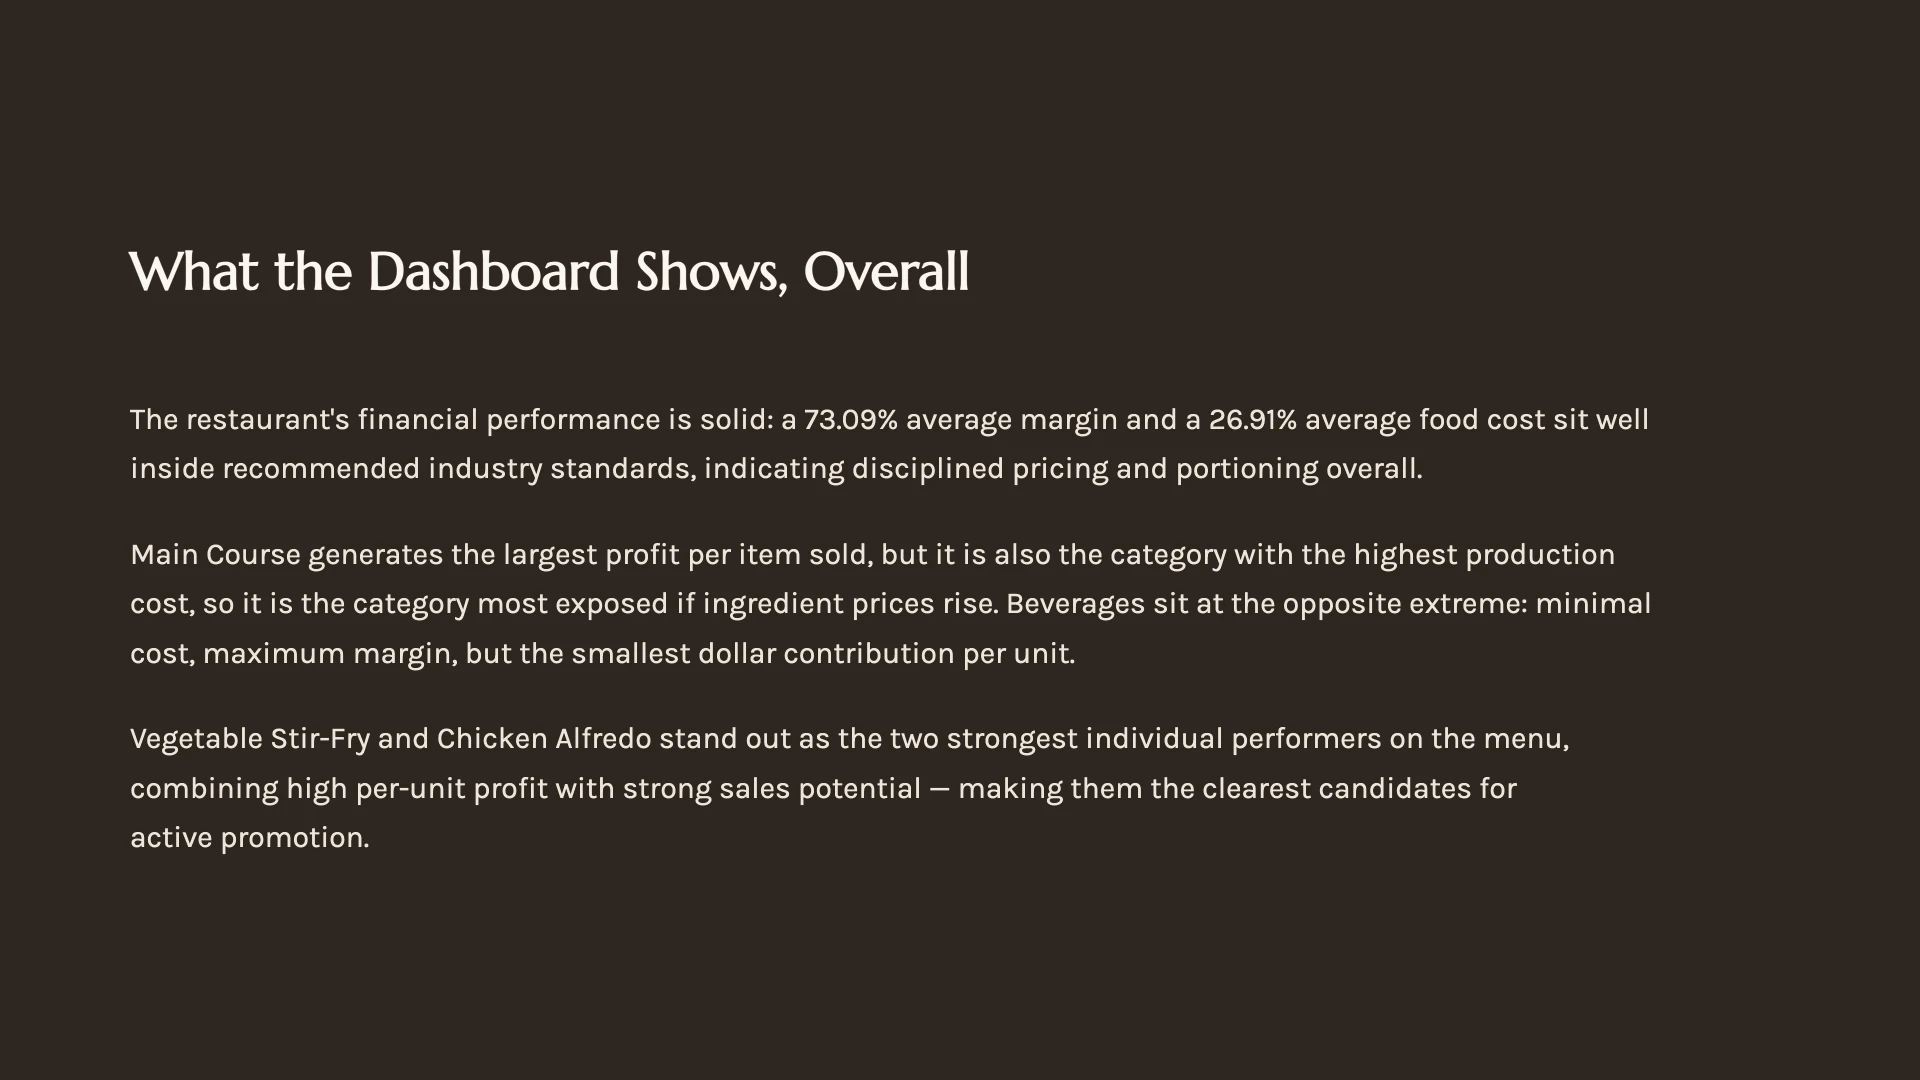
- Main courses generate the highest average unit profit ($14.24), making them the strongest revenue contributors
- Beverages achieve the highest average profit margin (86.84%) thanks to their relatively low production costs
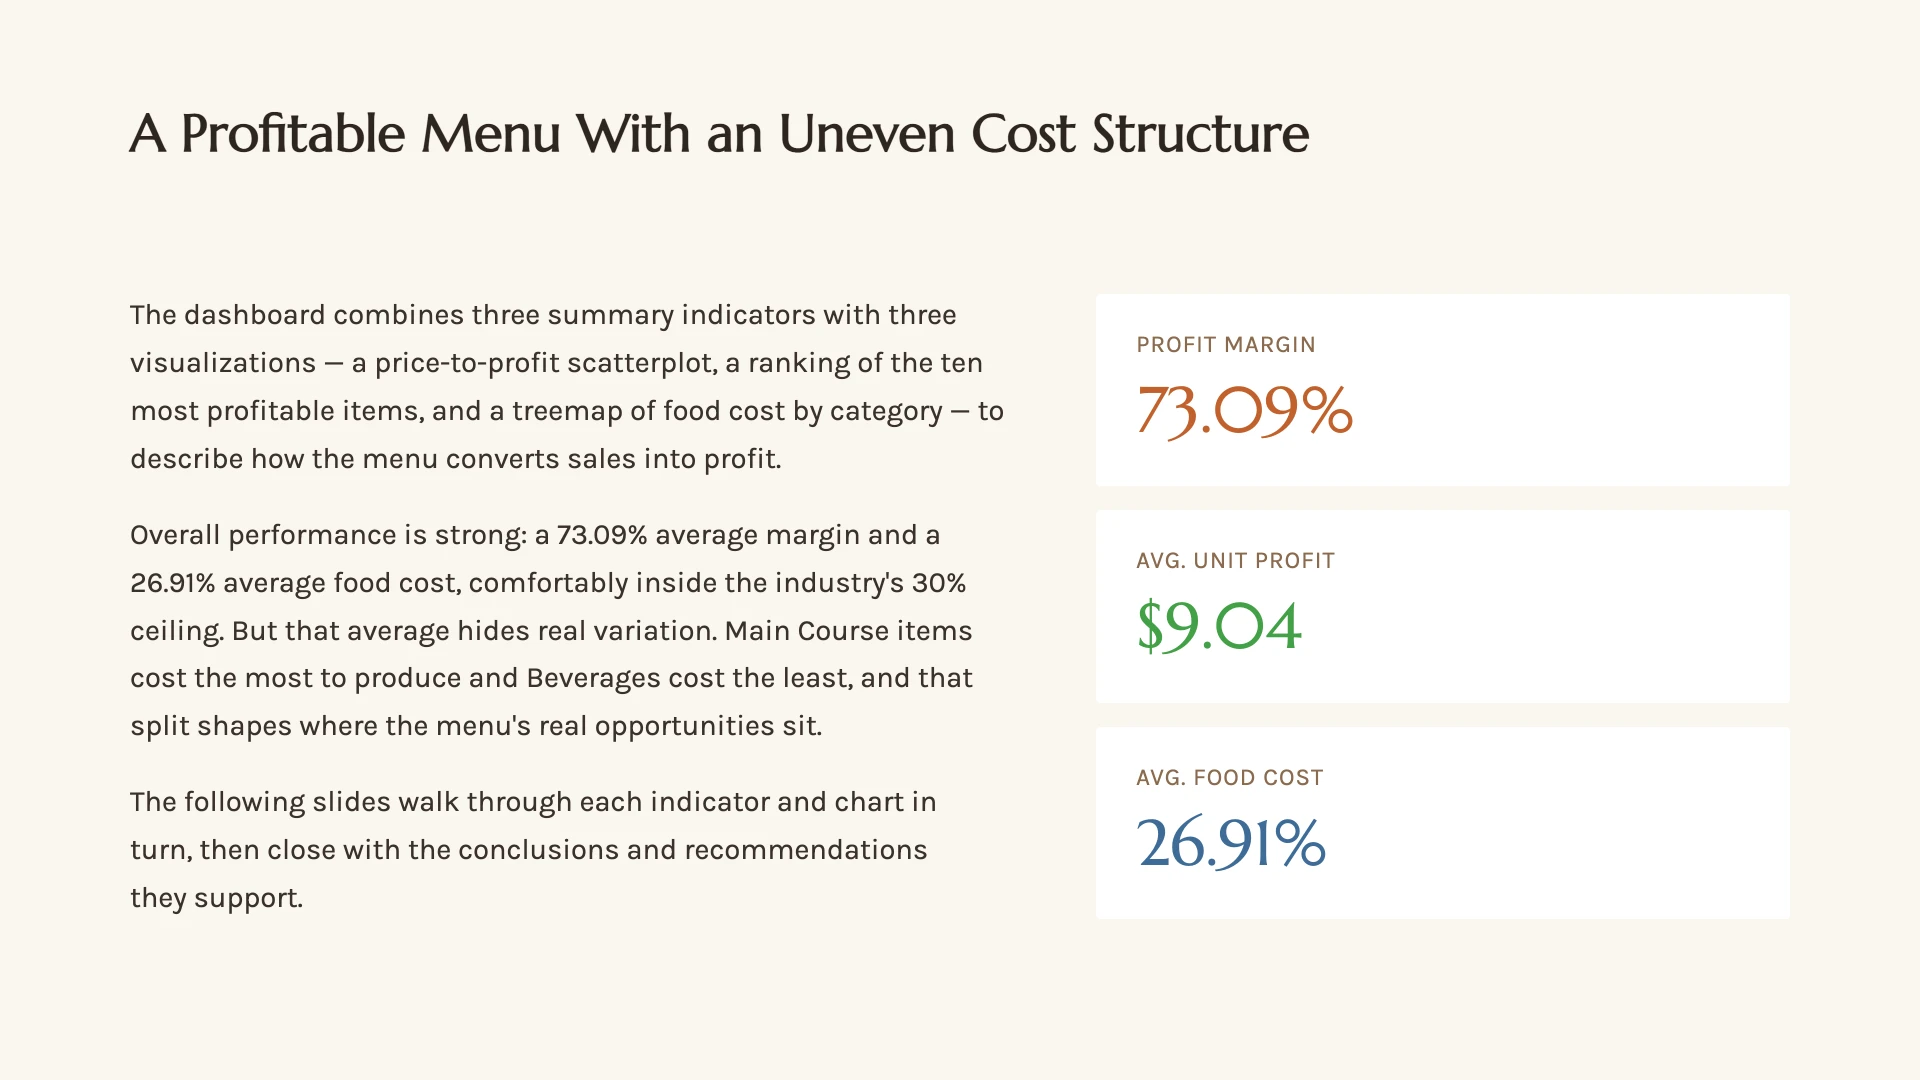
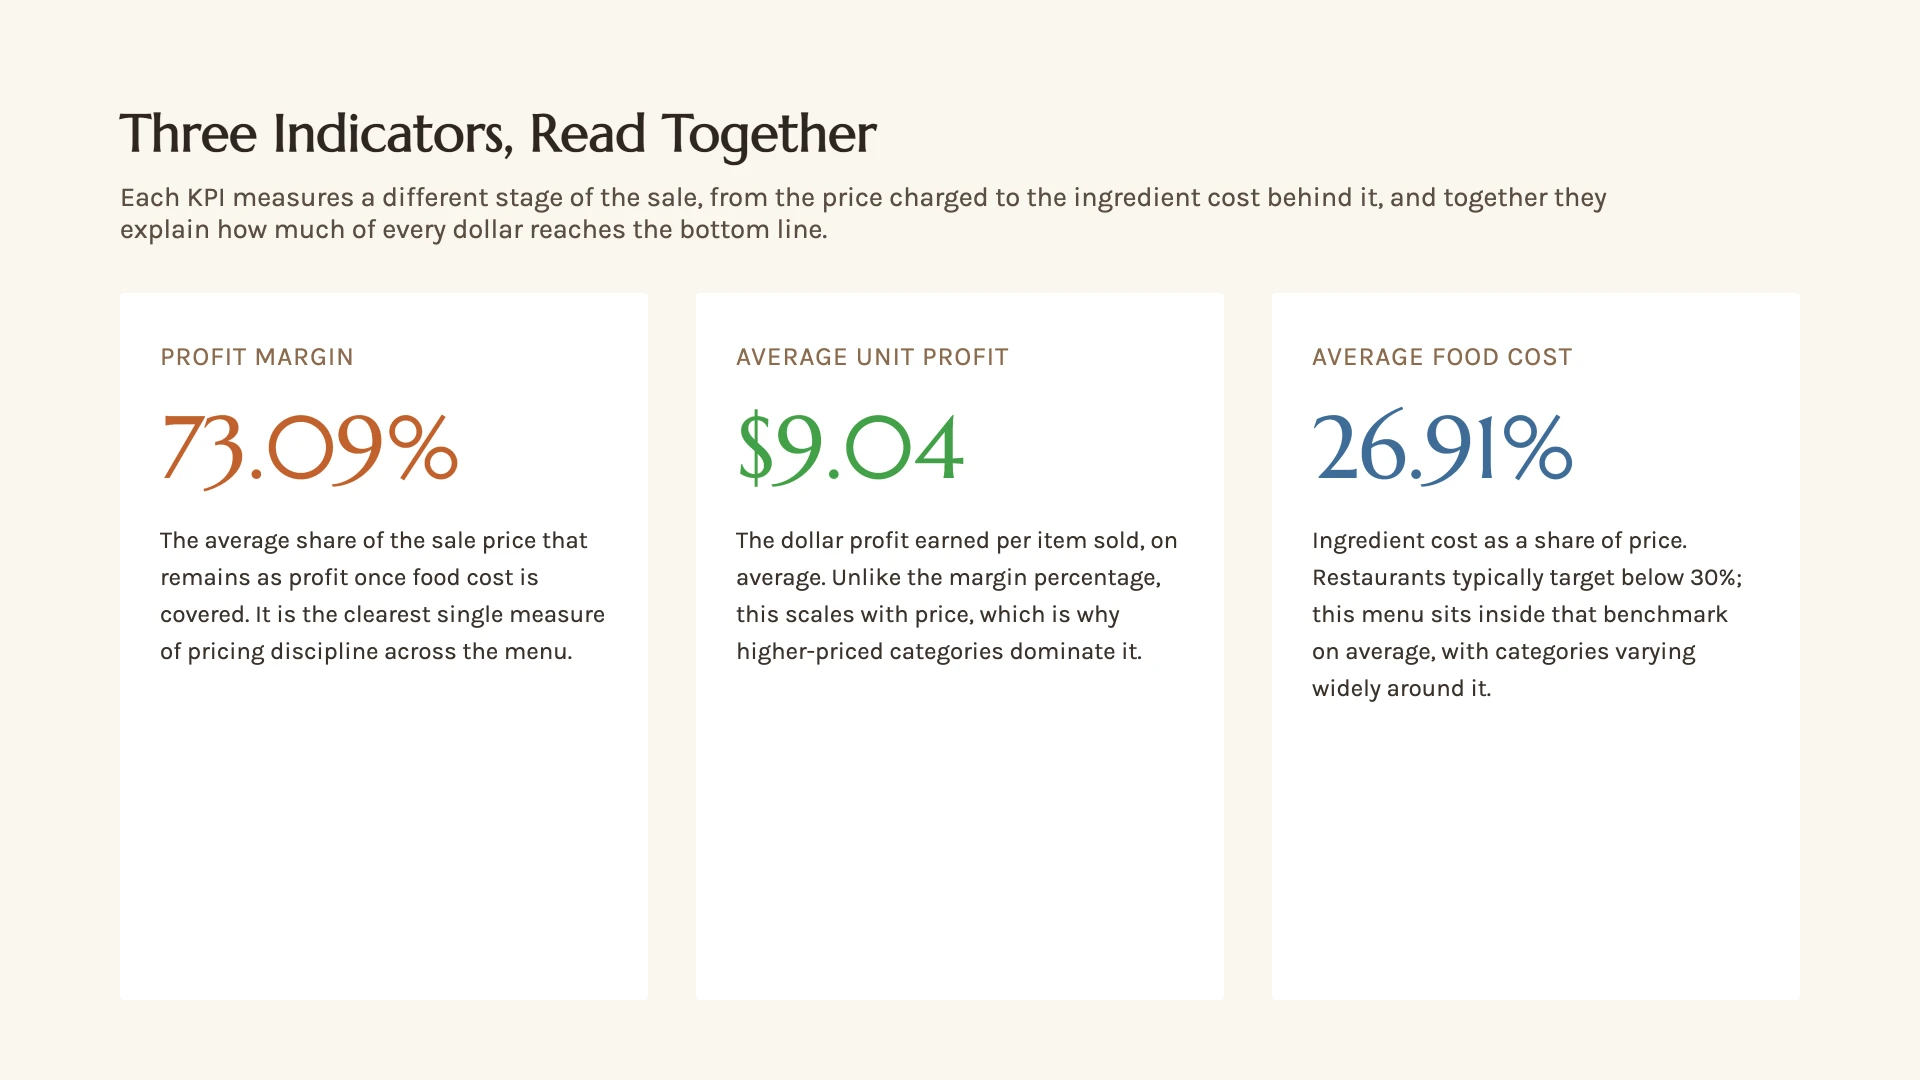
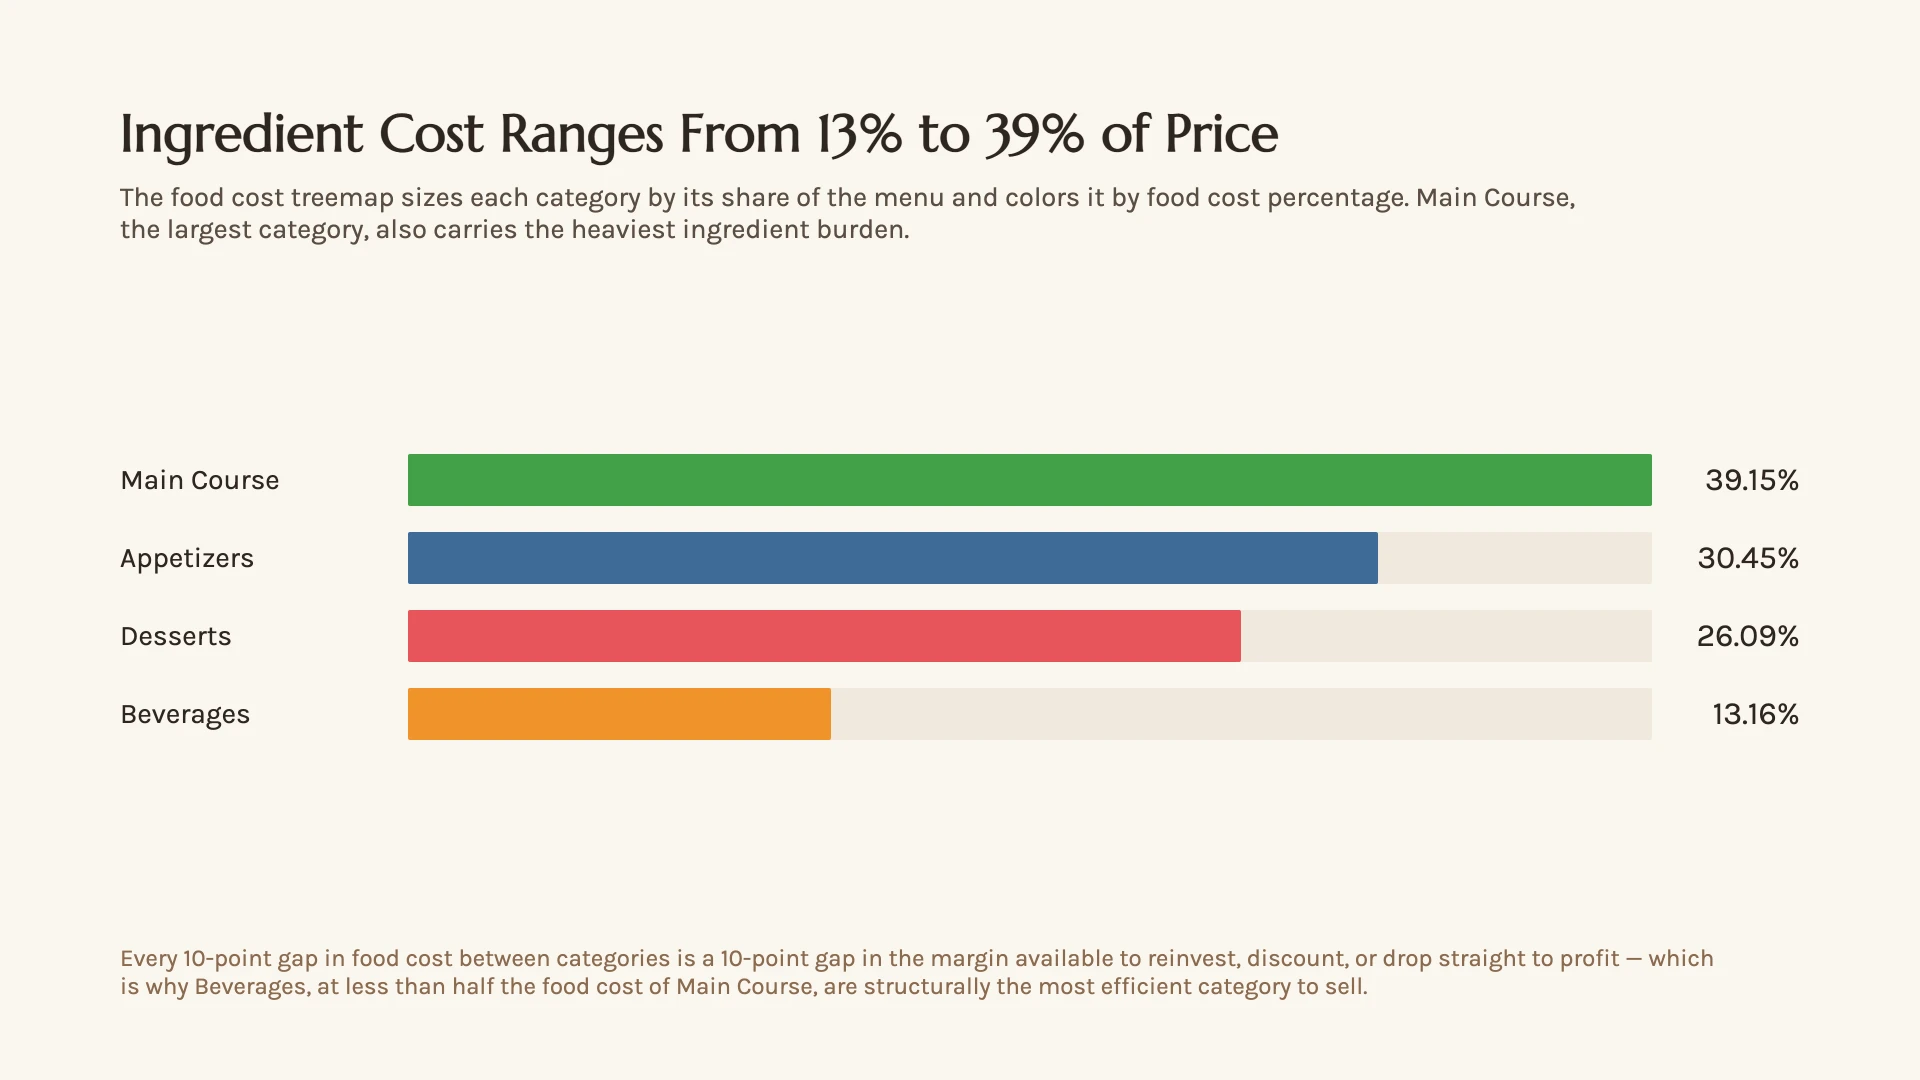
- Overall average food cost percentage is 26.91%, staying within a healthy range for restaurant operations
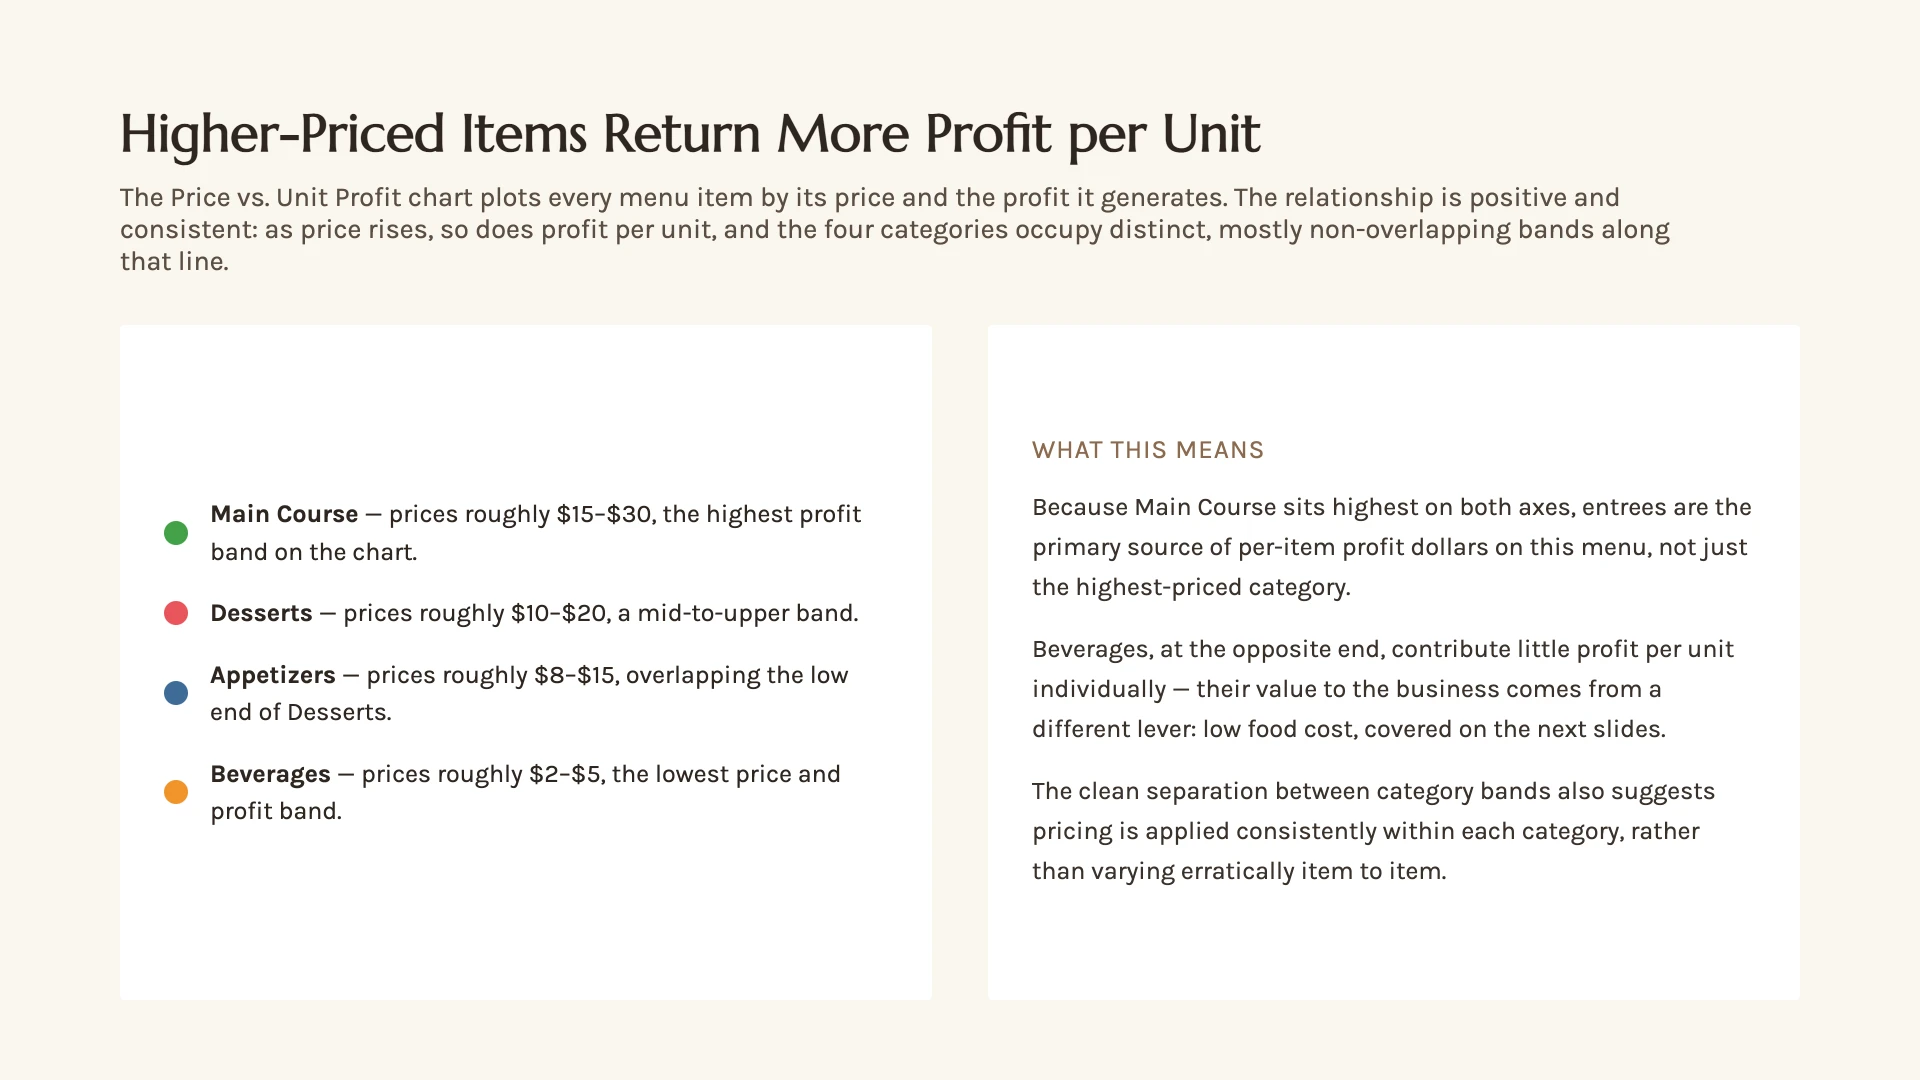
- A strong positive relationship exists between menu price and unit profit, meaning higher-priced items generally drive greater profitability
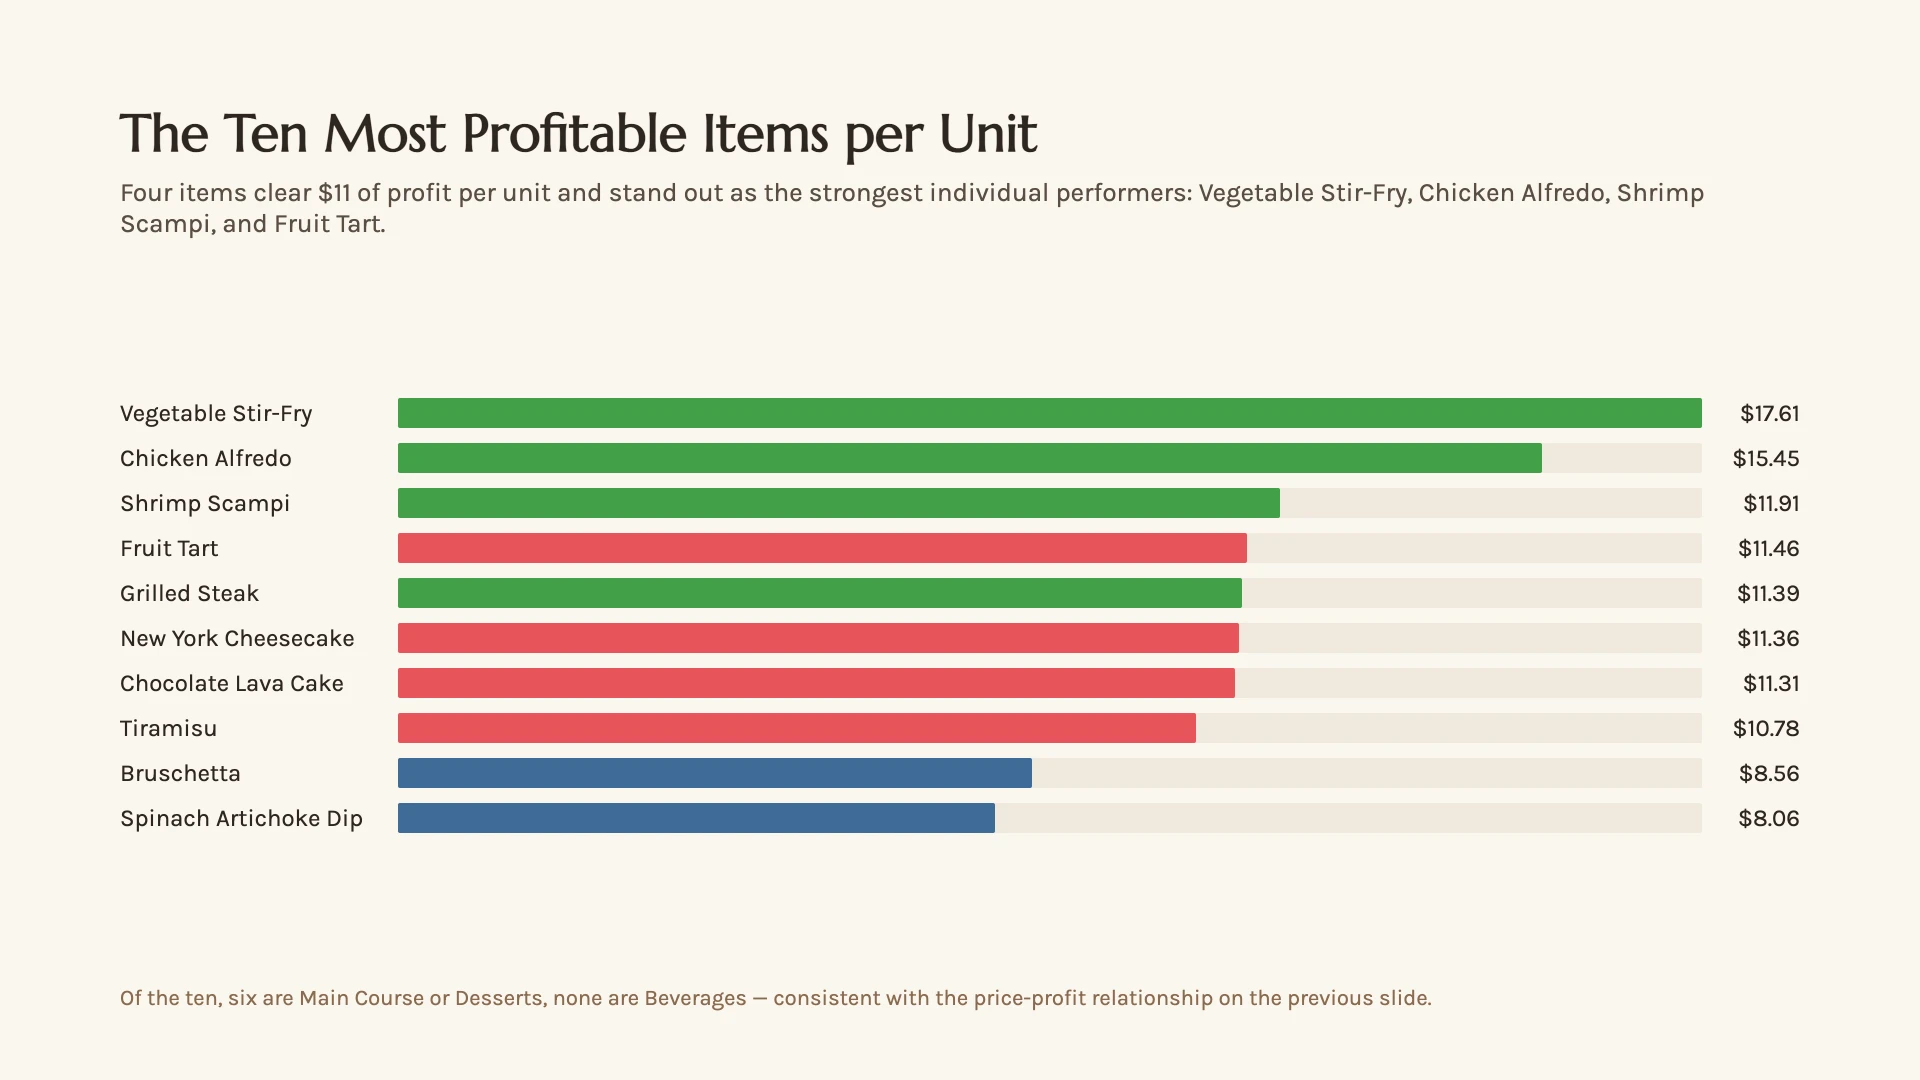
- Vegetable Stir-Fry and Chicken Alfredo are the top-performing menu items by average unit profit
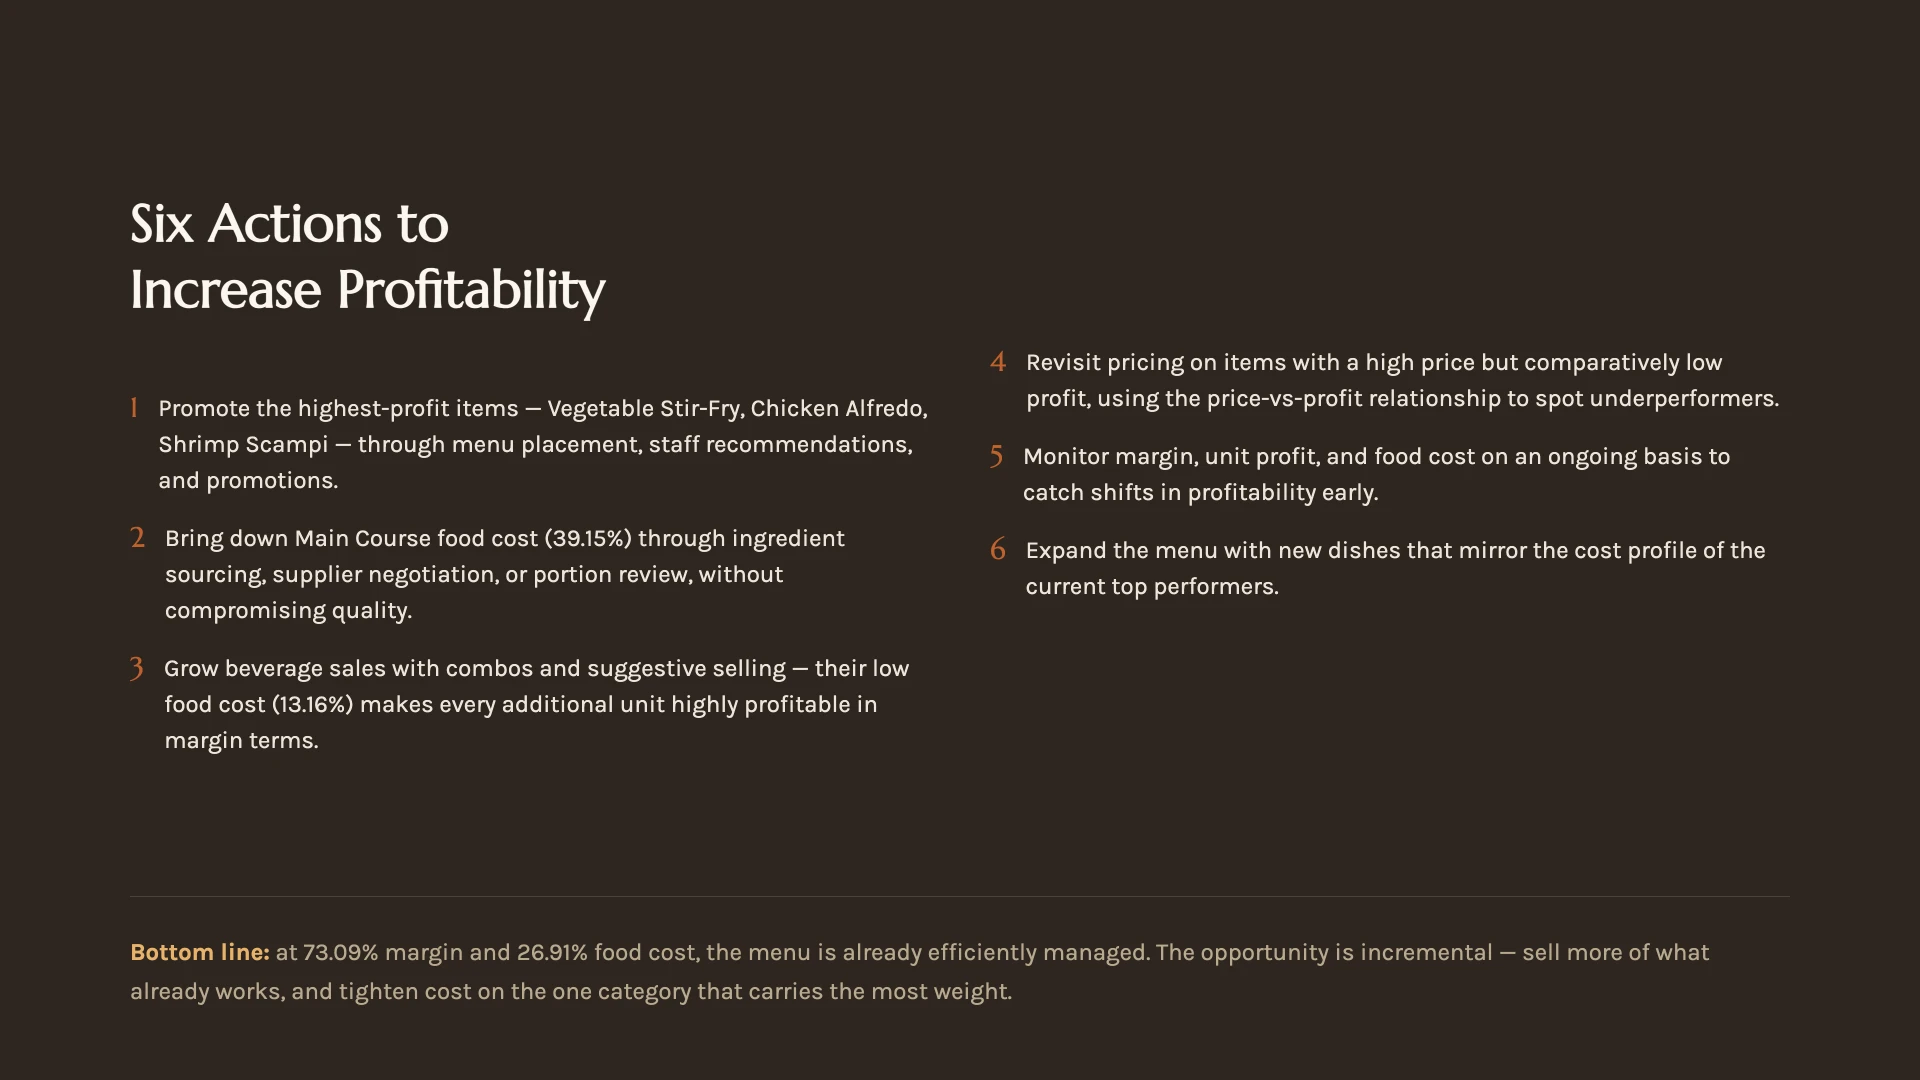
- Food cost varies significantly across categories, highlighting opportunities to optimize pricing and ingredient management for main courses