Global Retail — Customer Segments & Revenue
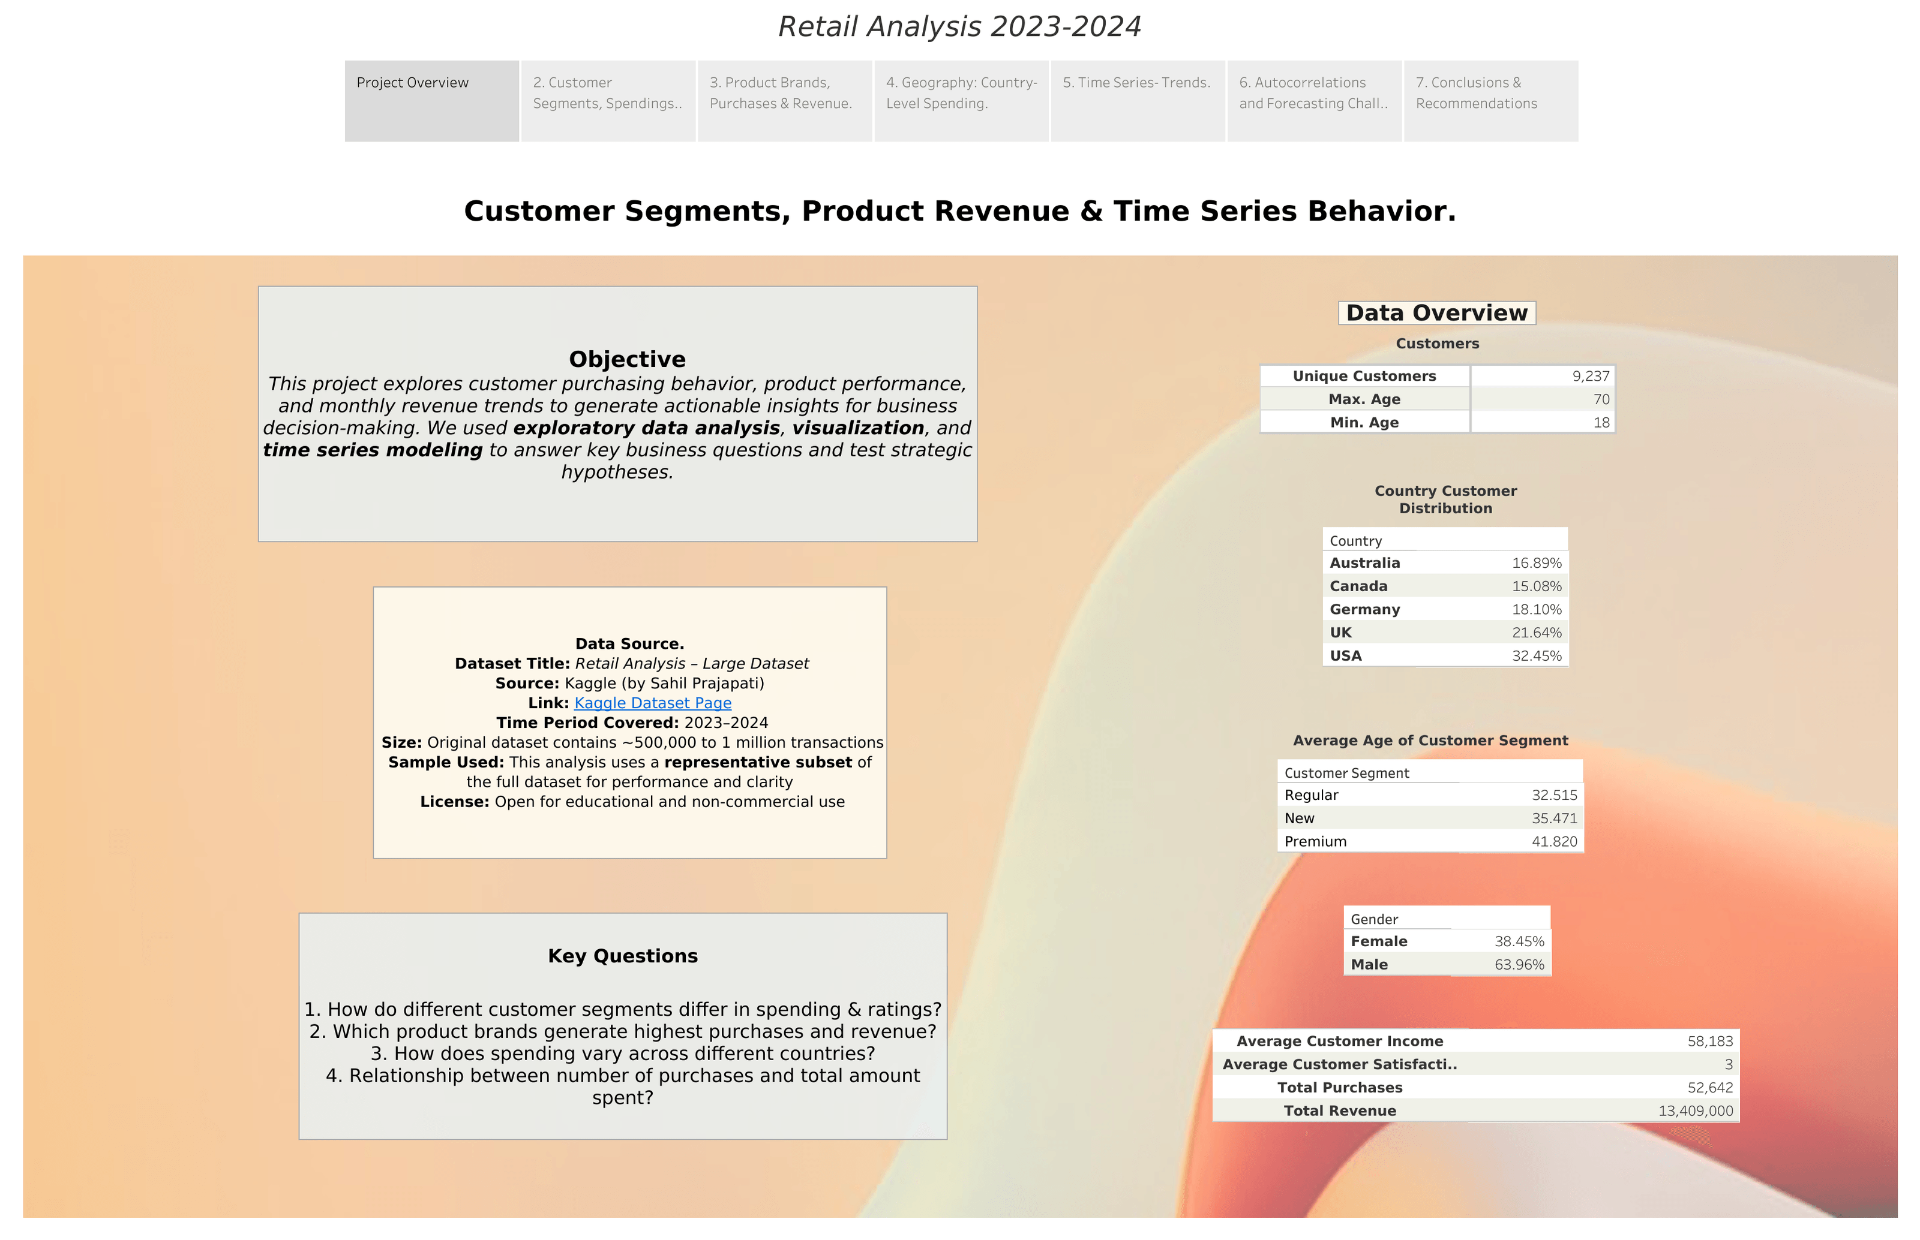
This project takes a half-million-row global retail dataset and runs it through a full analytical pipeline: cleaning, exploratory analysis, K-Means clustering, linear regression, and time series decomposition.
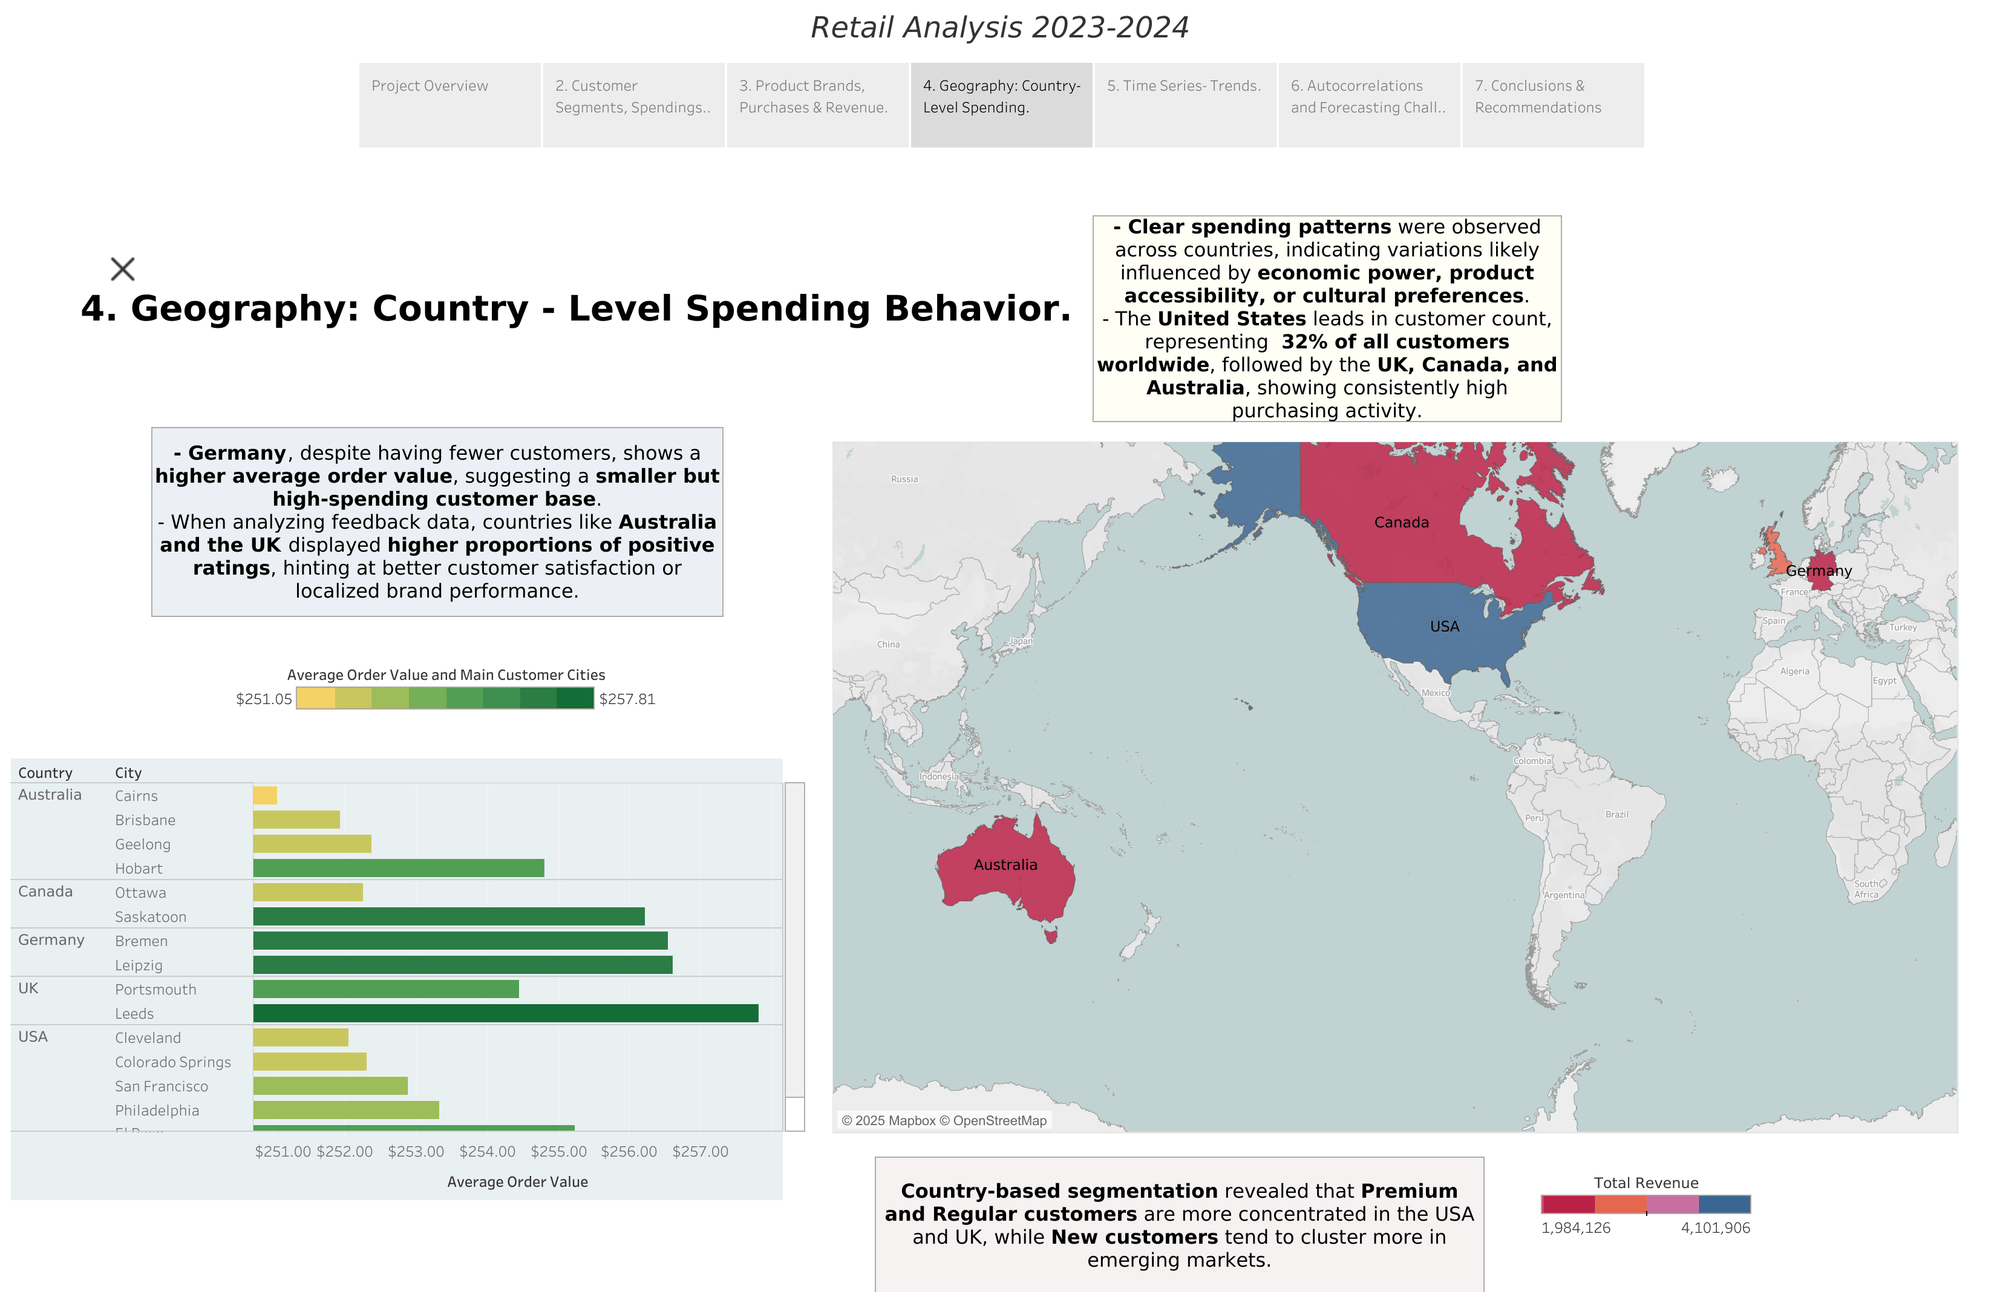
Customer segmentation surfaced regular customers as the highest-value segment ($6.3M in revenue), reframing strategy around retention rather than acquisition. Geographic analysis showed the USA leading on volume (32% of customers) while Germany delivered the highest average order value.
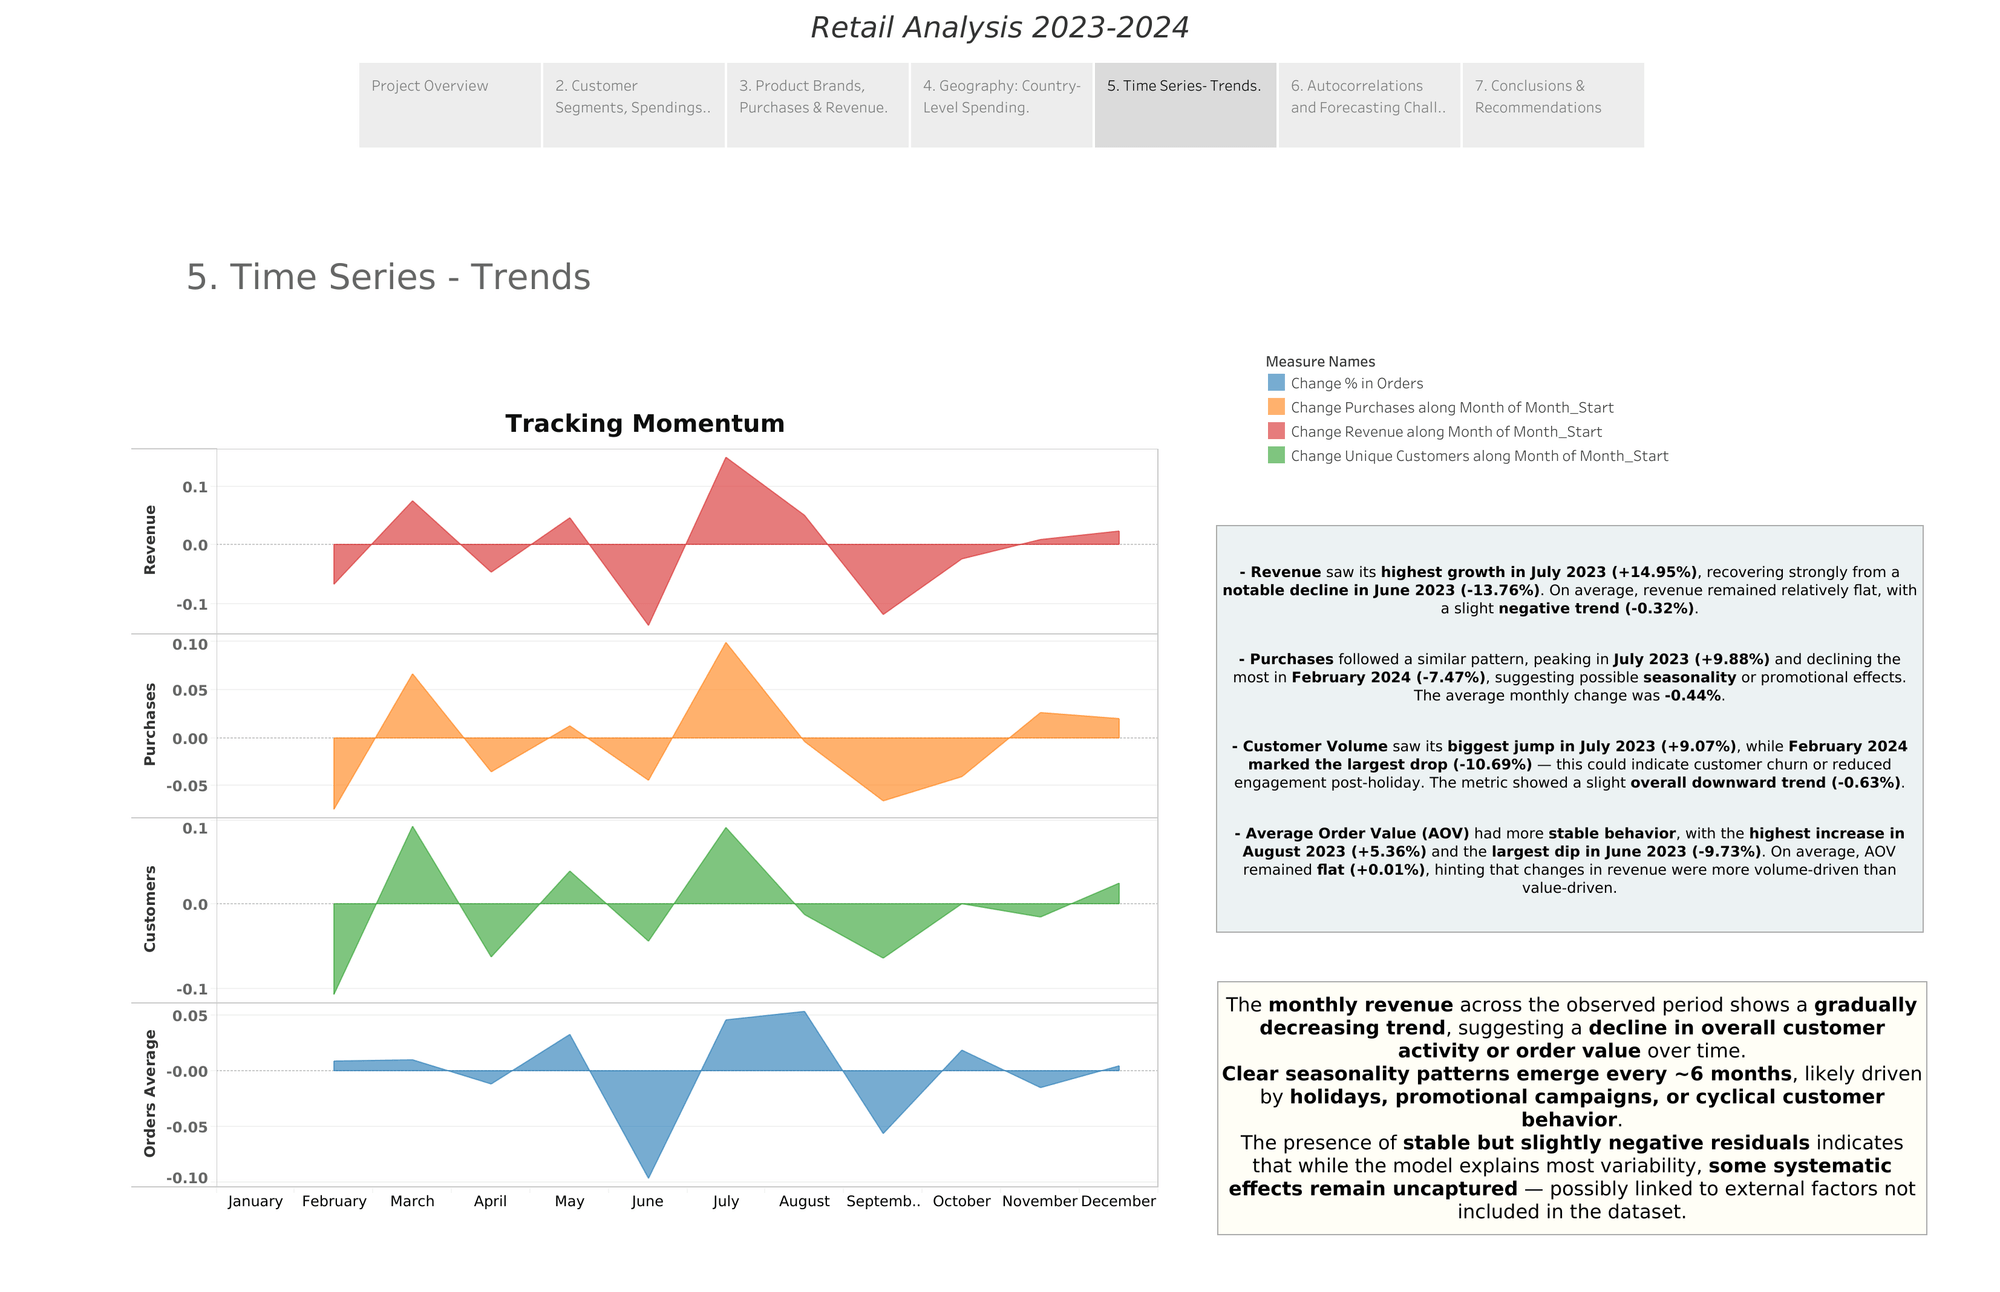
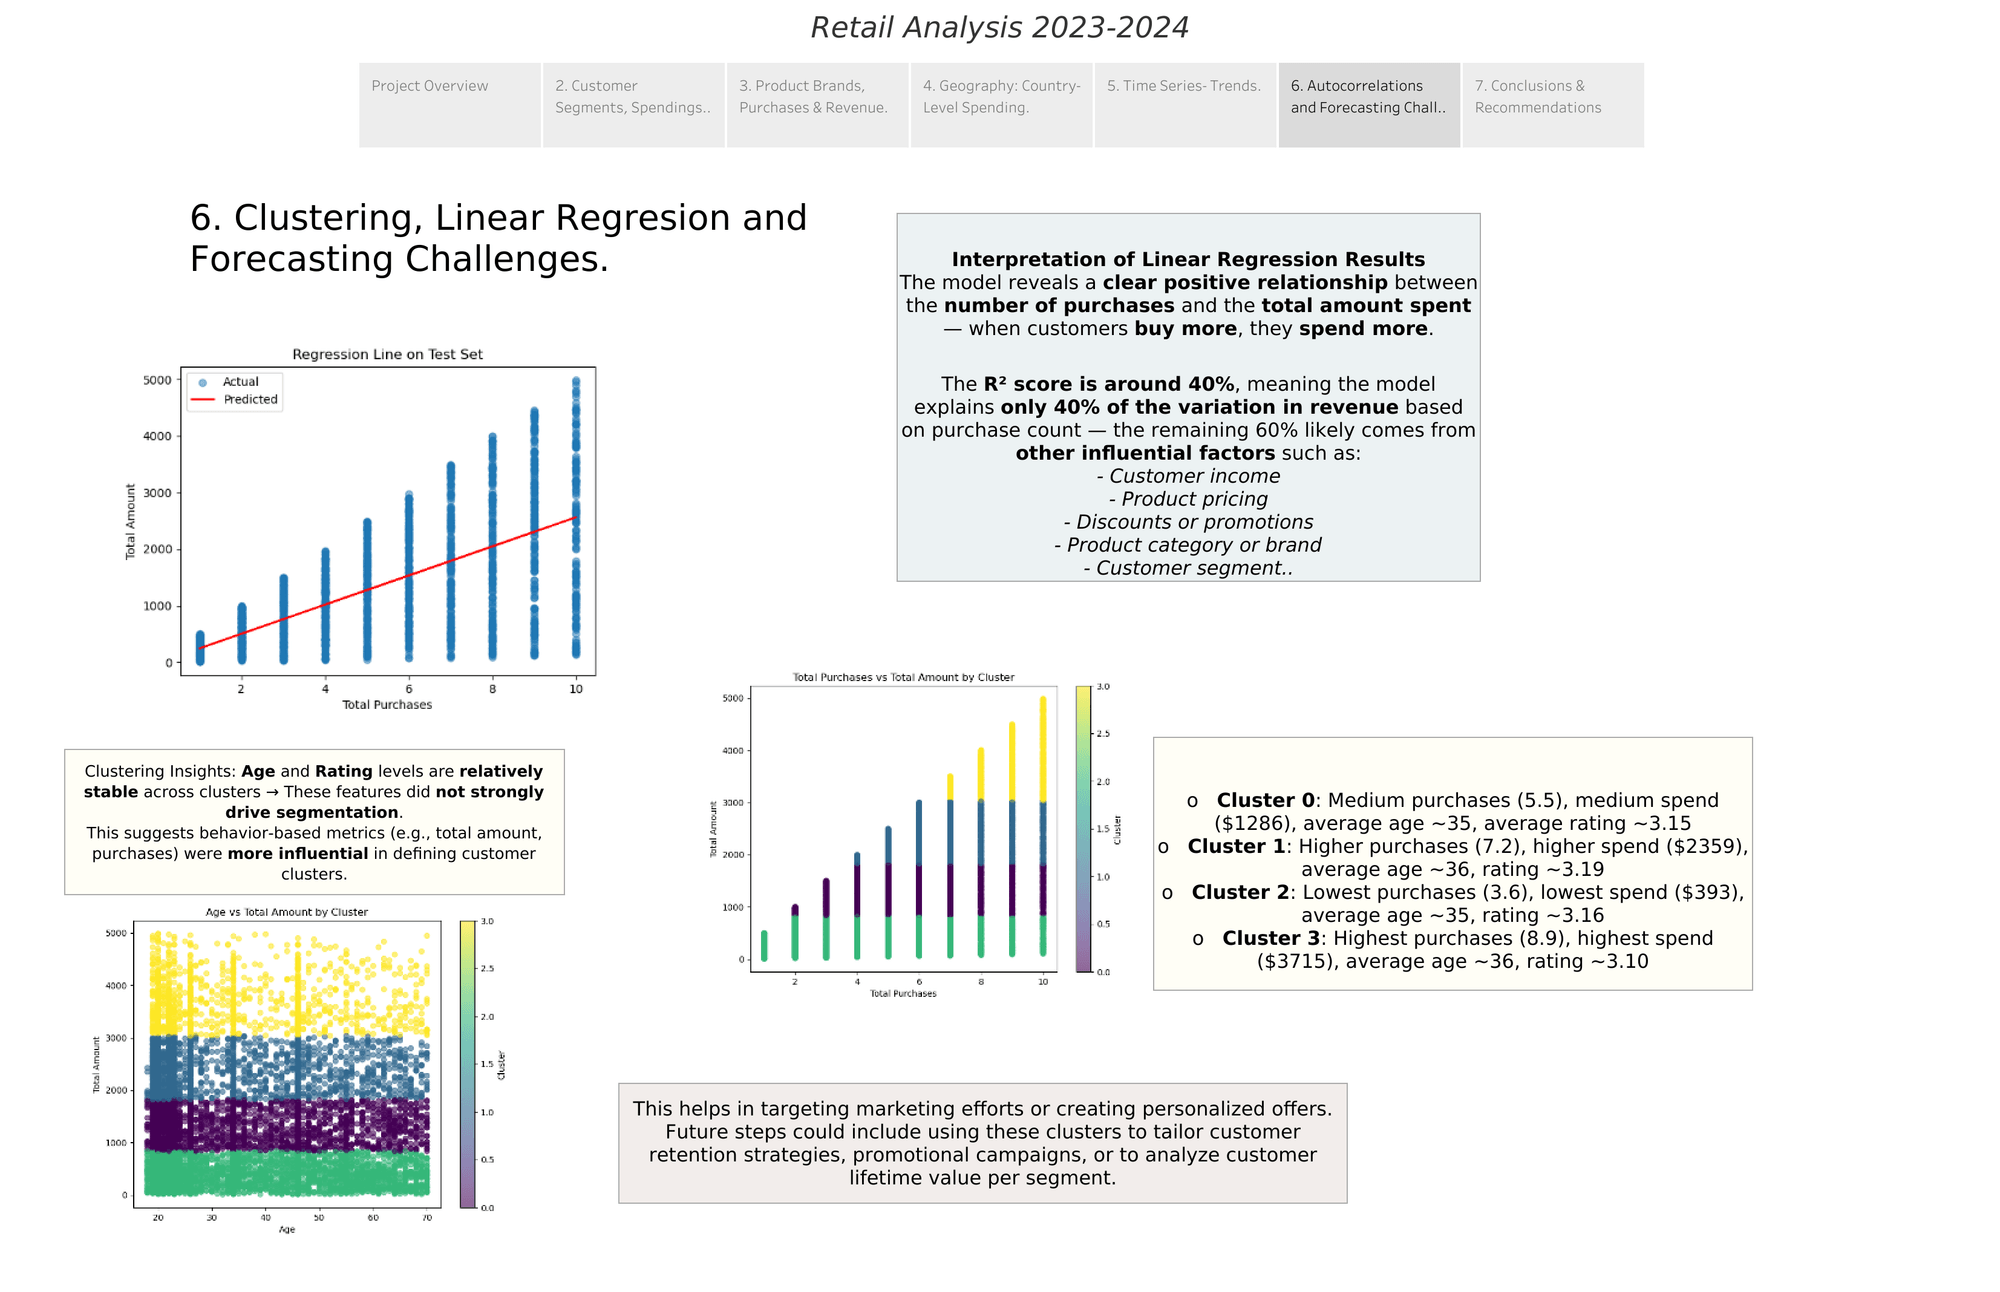
Time series decomposition uncovered clear ~6-month seasonality cycles and a July 2023 revenue peak (+14.95%), while regression analysis showed purchase count explains ~40% of revenue variation (R²=0.40) — a useful but partial predictor that flagged the need for richer features.
Python (pandas, scikit-learn, matplotlib), K-Means clustering, linear regression, time series decomposition, Tableau, Jupyter Notebook
Customer segmentation, cluster behaviour analysis, geographic revenue mapping, regression modelling, time series decomposition and seasonality detection.
- Regular customers identified as highest-value segment — retention strategy prioritised over acquisition
- Top-performing brands and high-spend regions mapped for strategic targeting
- Time series decomposition revealed seasonal bounce-back patterns and autocorrelation forecasting challenges