Citi Bike NYC — Usage Patterns & Operations
Citi Bike publishes one of the richest open mobility datasets in the world — every trip, every station, every second. This project joined the 2022 trip data with NOAA weather records to model what actually drives usage in a city as climatically variable as New York.
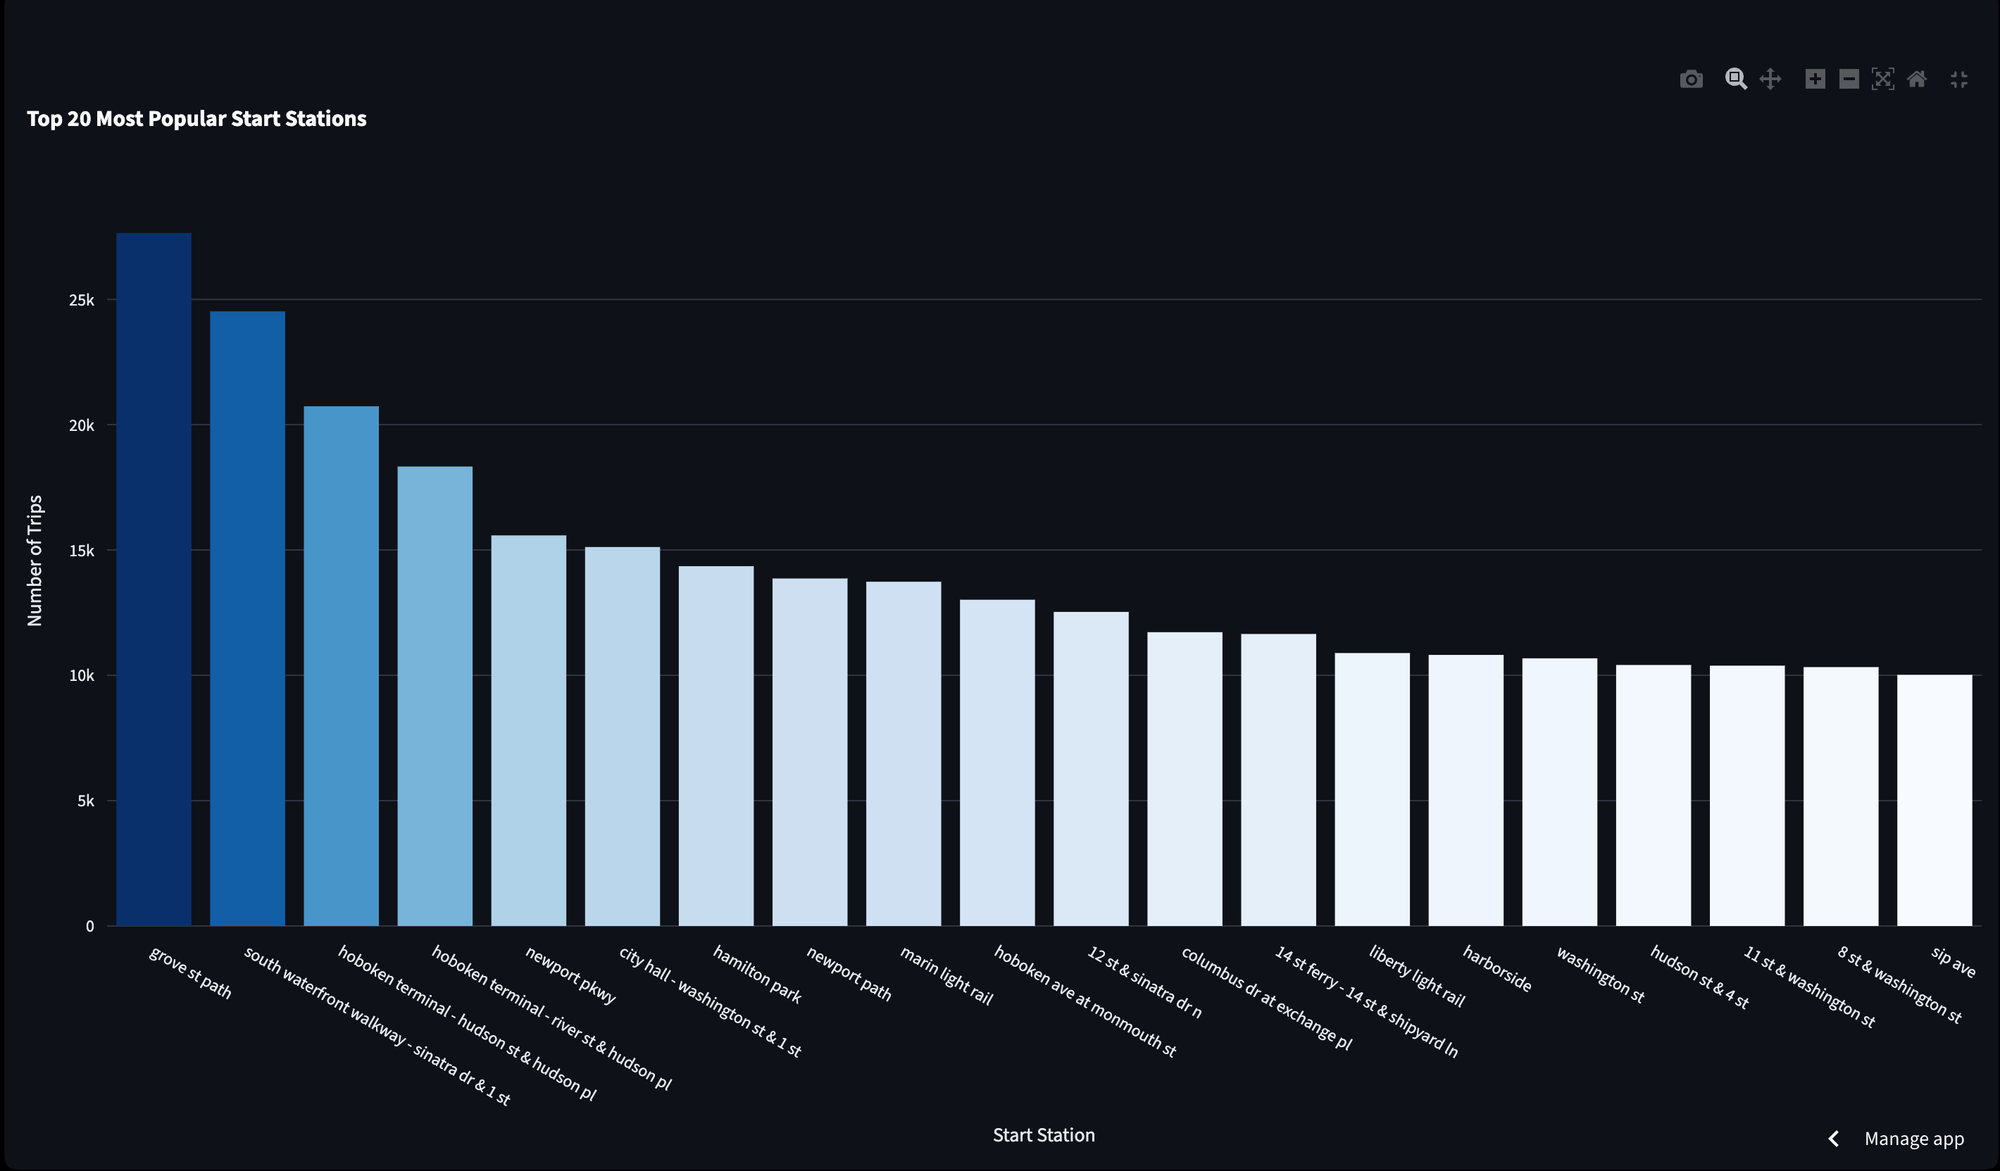
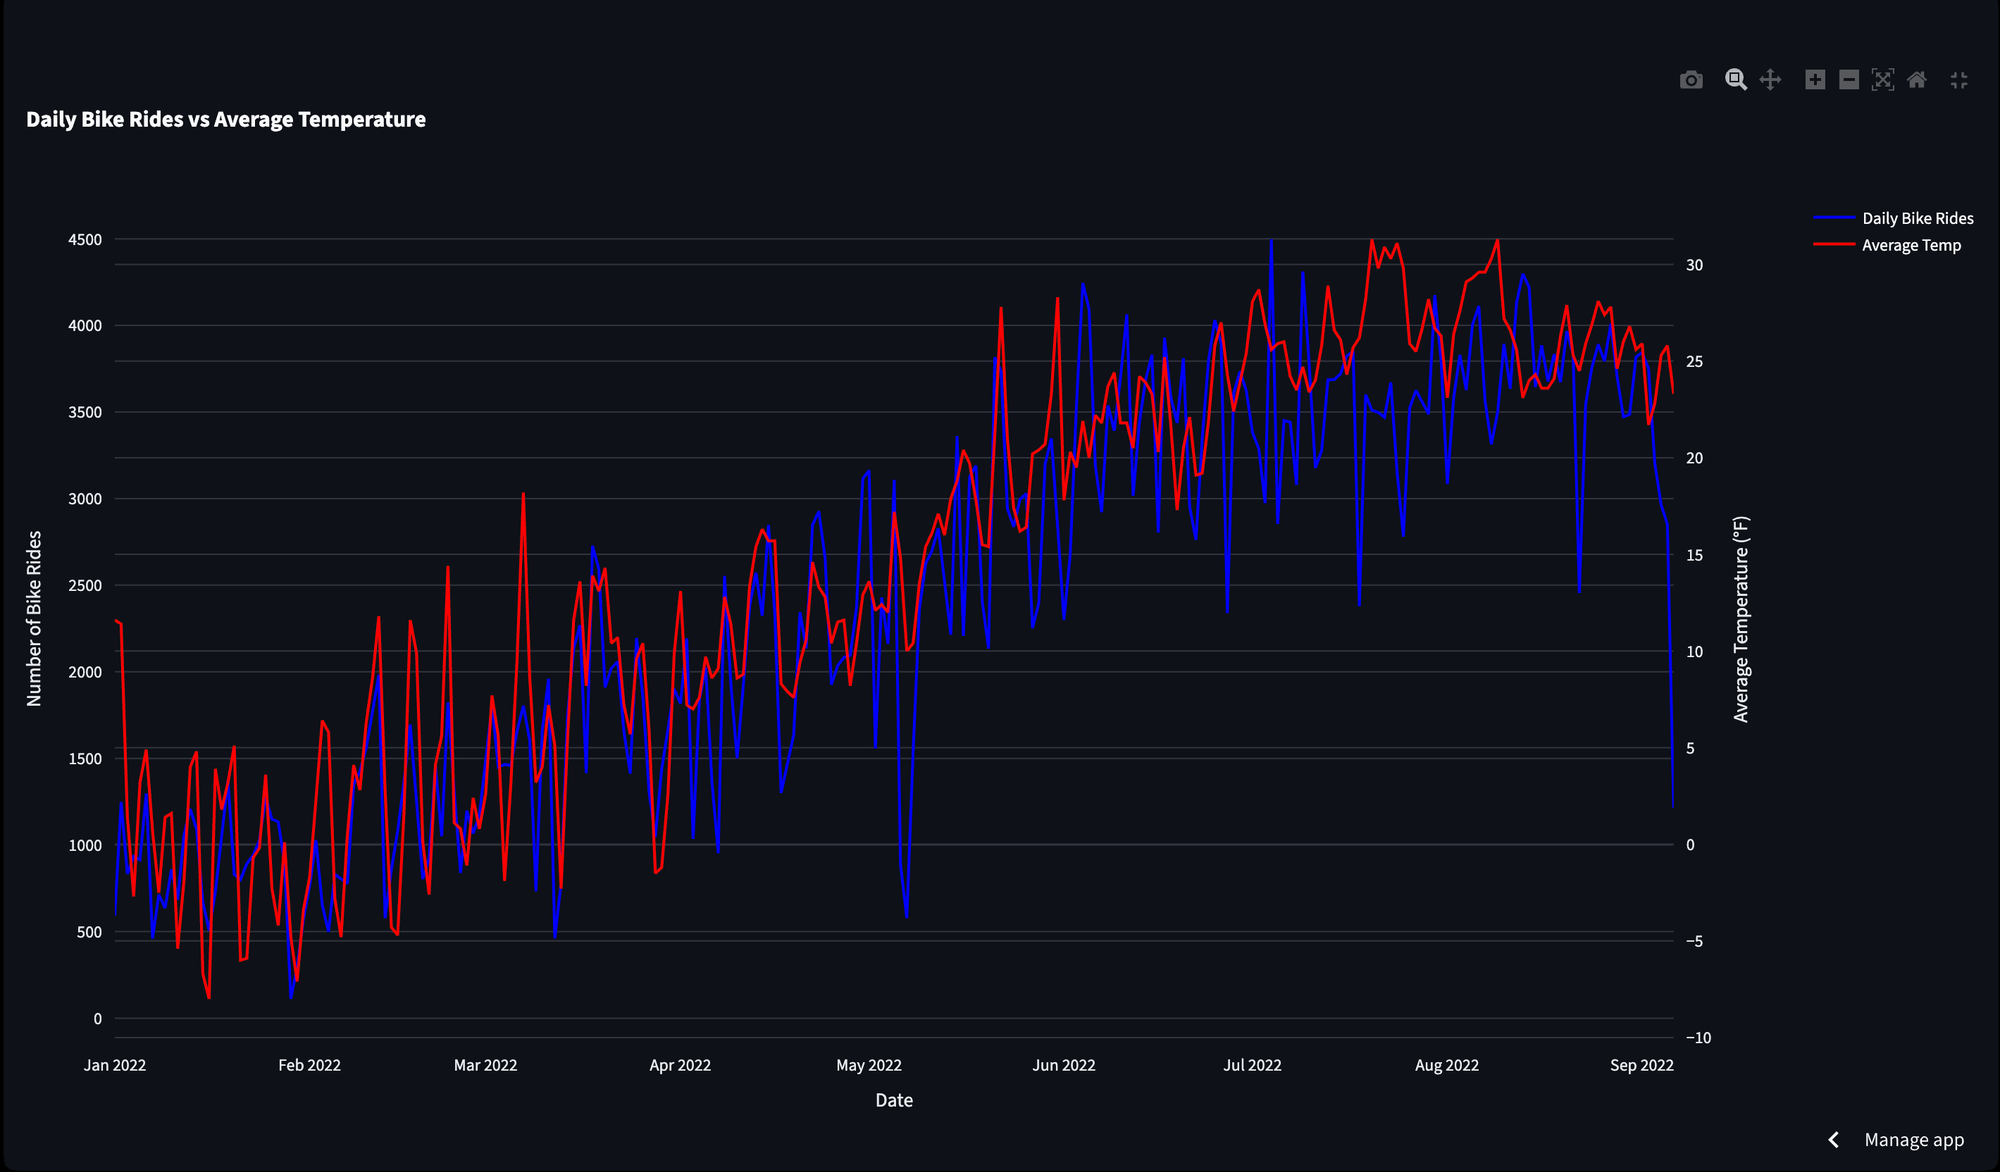
Top stations like Grove St PATH (~27K trips) anchor the network, and a clear positive correlation between temperature and daily rides confirmed the operational importance of seasonal staffing and redistribution planning. Commuter vs. leisure patterns were segmented by hour and user type for planning insights.
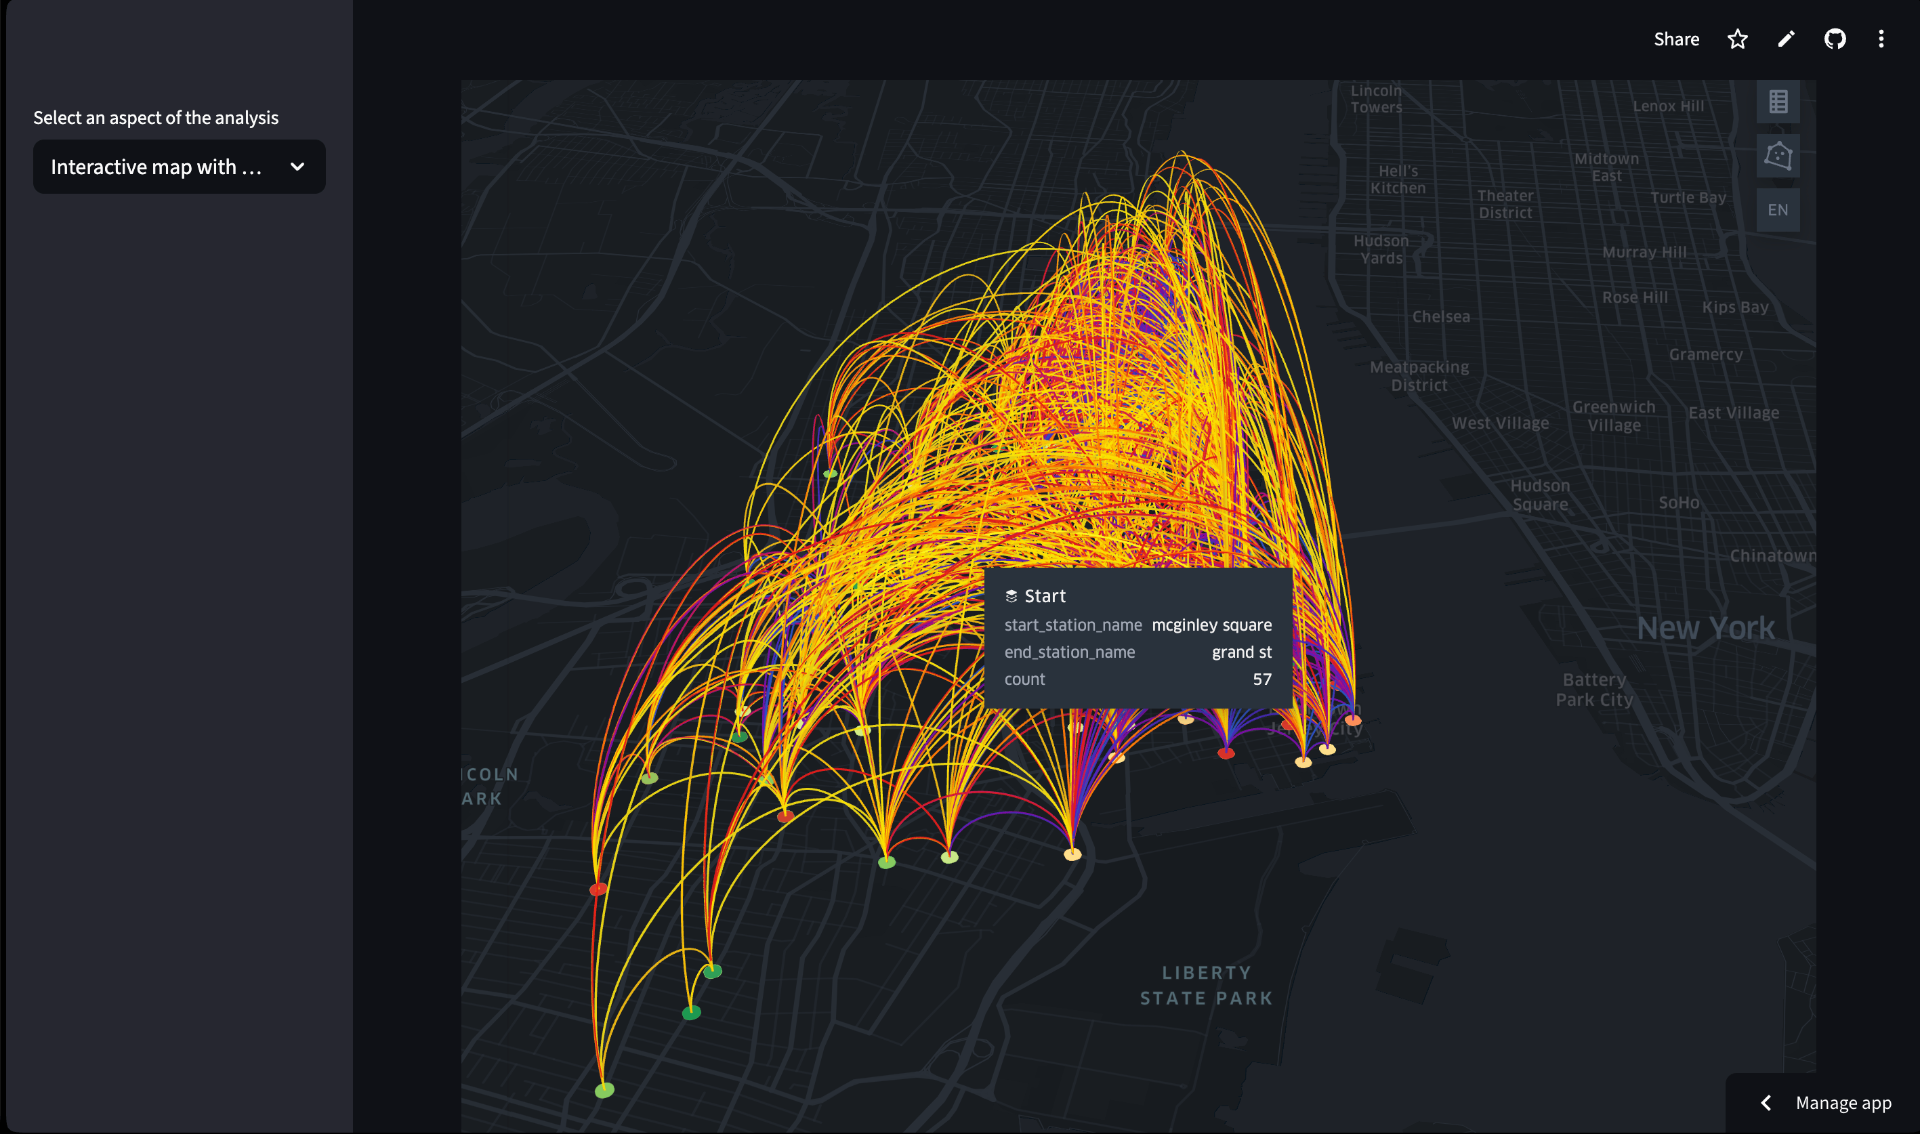
The final deliverable is an interactive Streamlit dashboard with Kepler.gl trip-flow maps — letting stakeholders explore station-to-station patterns, identify bottlenecks, and pressure-test redistribution scenarios directly.
Python (pandas, geopandas), Tableau, Streamlit, Kepler.gl, NOAA weather data integration
Trip-flow geospatial analysis, weather correlation, station bottleneck detection, commuter vs. leisure segmentation, interactive dashboard delivery.
- Weather correlation analysis showed clear impact on daily trip volume — temperature threshold identified
- High-traffic station bottlenecks mapped with Kepler.gl — redistribution recommendations delivered
- Commuter vs. leisure usage patterns segmented by hour and user type — operational planning insights